These 19th-century maps changed poverty in London. Today we have all the information we need to act
A new exhibition of groundbreaking maps shows how poverty was investigated in the late 19th century. More than a century later, we have all the information we need to take action
by: Ben Rogers
23 Oct 2026
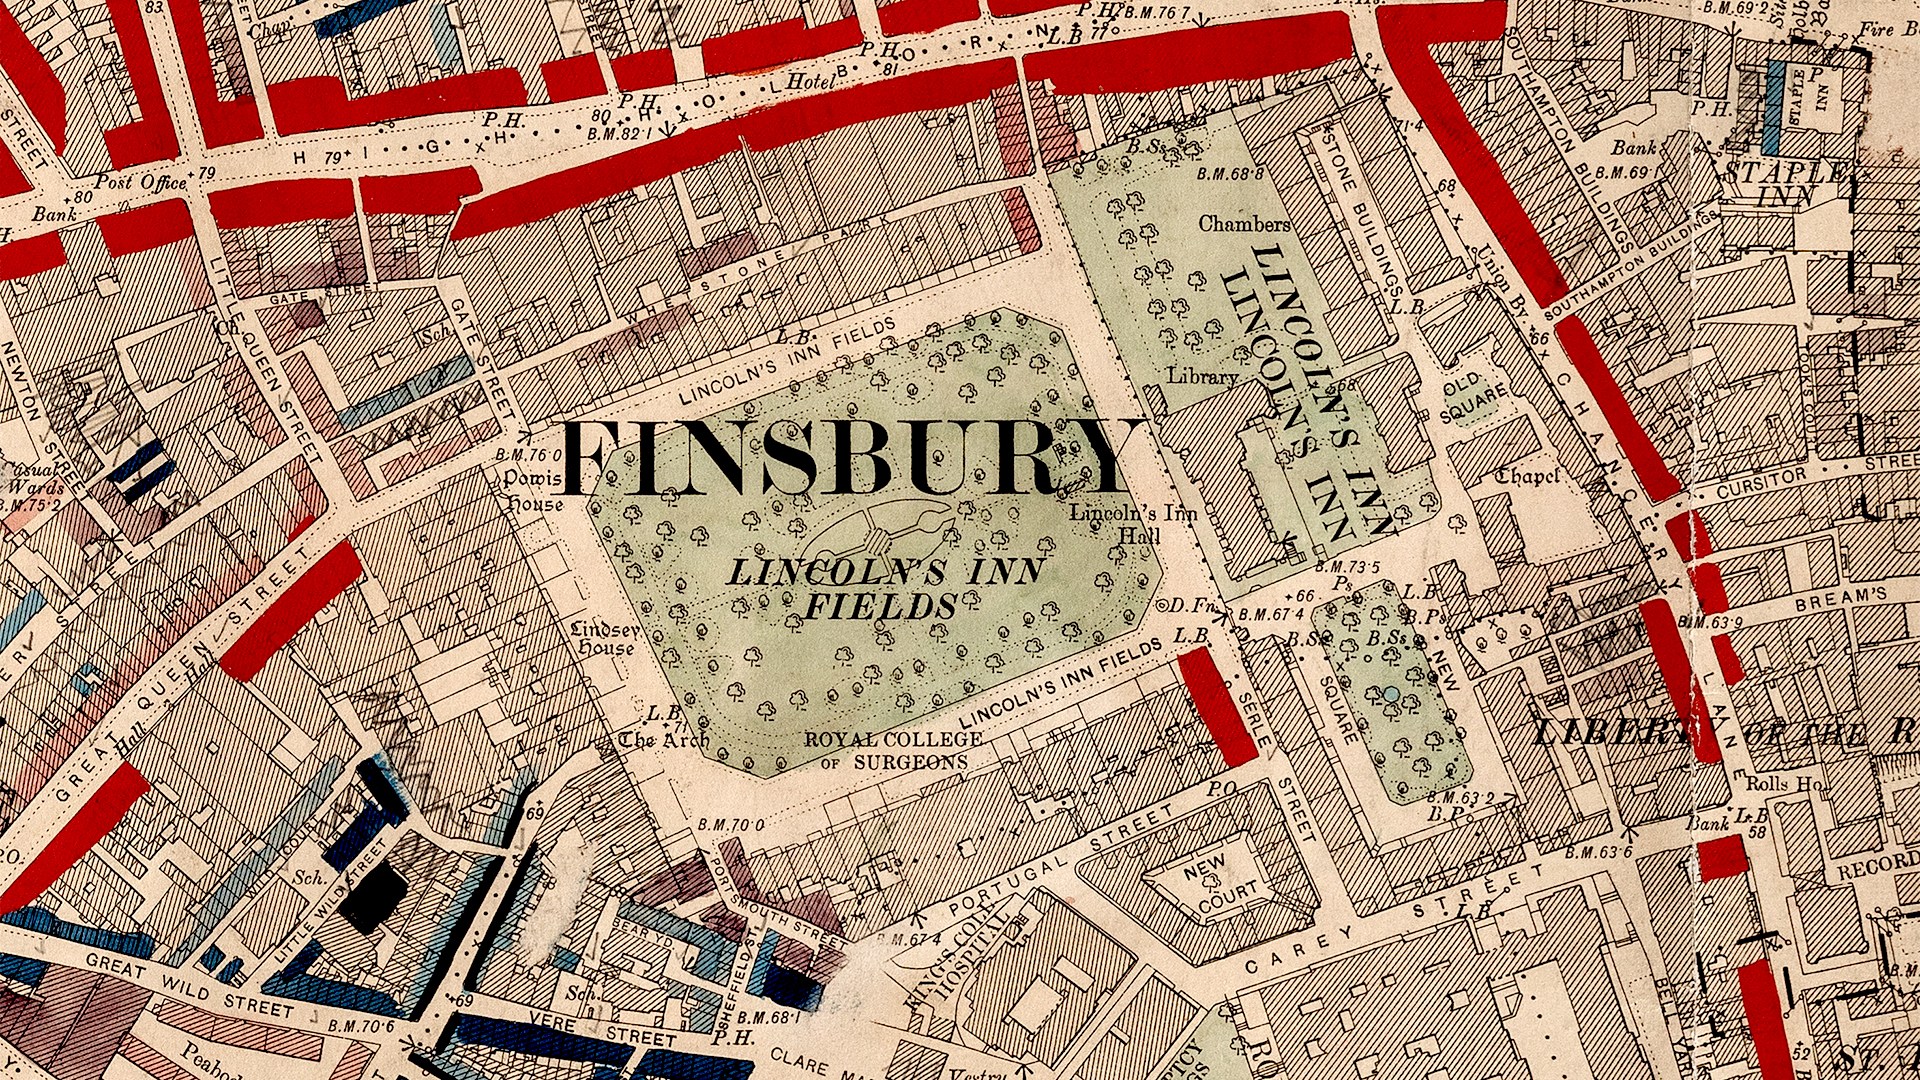
Charles Booth's 1889 colour-coded map of poverty in London. Image: Charles Booth Archive / London School of Economics
Share
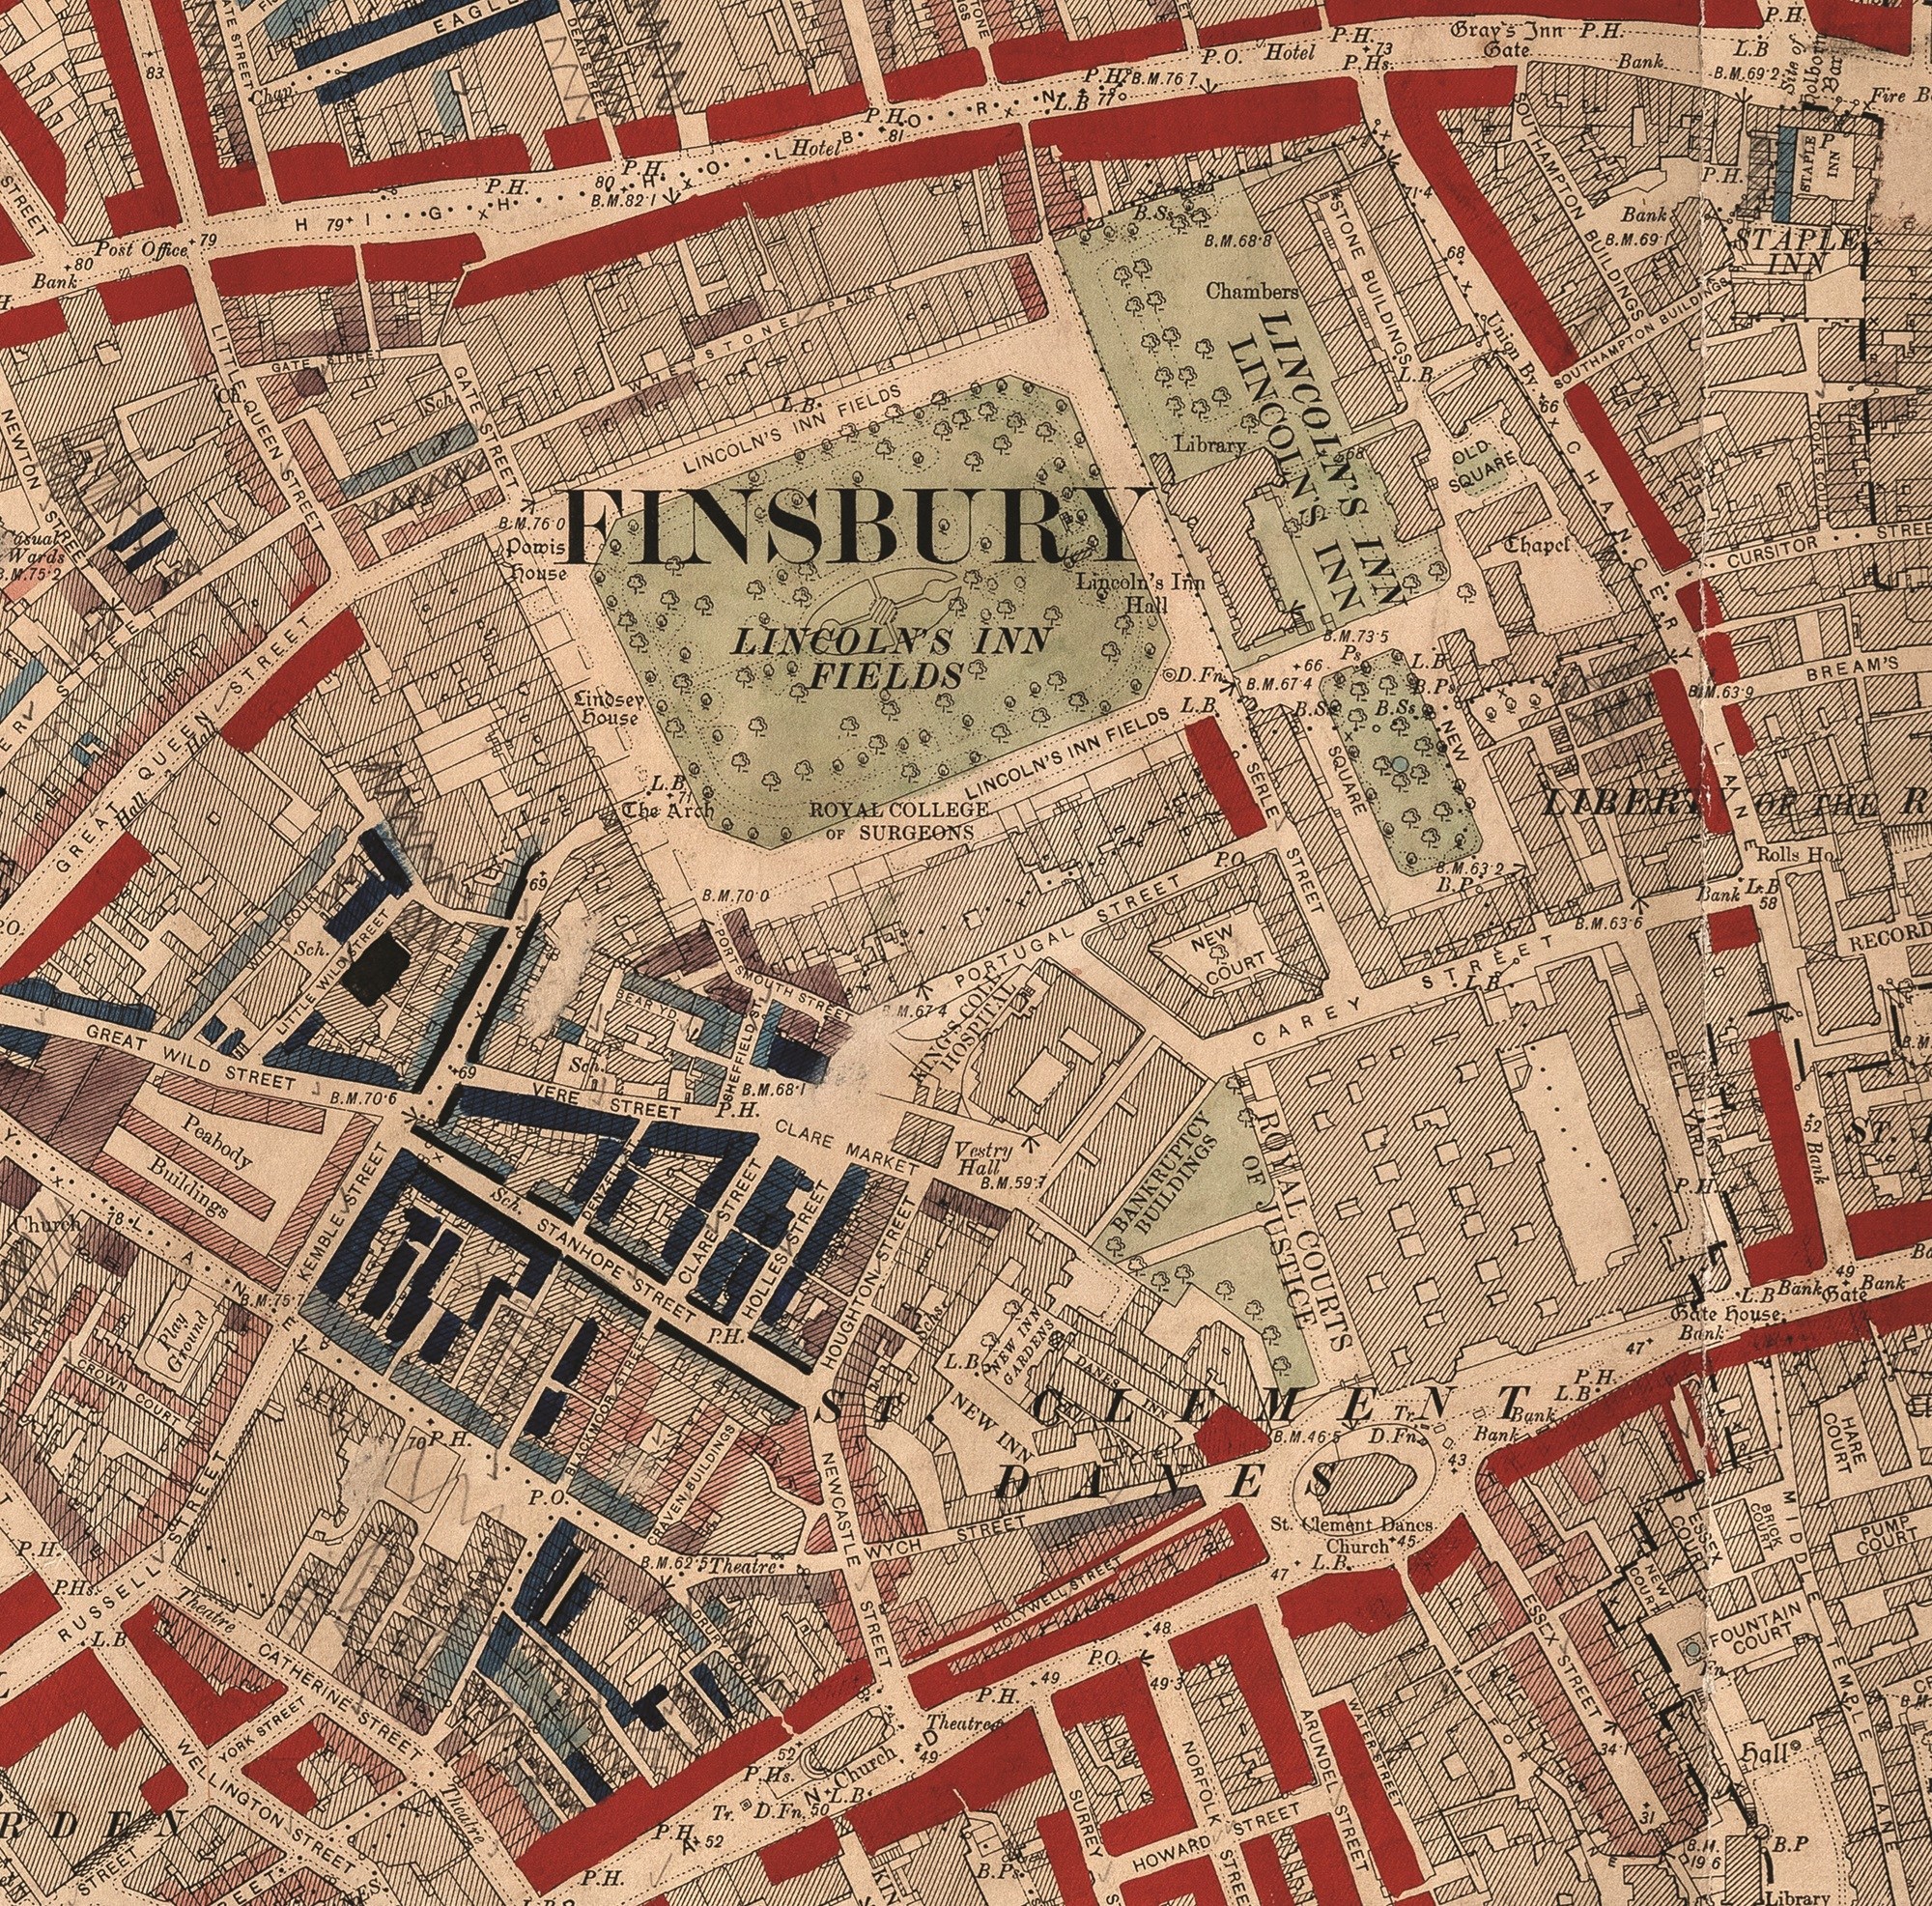
In 1889 a Liverpool shipowner published a groundbreaking map of London. Charles Booth coloured each street according to the circumstances of the people who lived there. Yellow areas denoted streets inhabited by the wealthy; red the well-to-do middle classes.
If your street was “in the pink” you were fairly comfortable, purple denoted a more mixed neighbourhood and people described as “poor” lived in areas marked blue. On the bottom rung were those areas marked in black, which Booth labelled “Lowest class. Vicious, semi criminal”.
The Booth maps are central to a new exhibition, A Place to Call Home: Poverty and Housing in London, which opens at Senate House Library on 23 October.
Booth set about his task in a bid to disprove a claim made by the socialist campaigner Henry Hyndman that one-quarter of Londoners lived in poverty. Booth thought this an exaggeration and put investigators to work sifting through reports from School Board Visitors, who called at residents’ homes and filled notebooks with observations.
Booth discovered that if anything, Hyndman had underestimated the scale of poverty in the capital and that the true figure was closer to 35%.
Booth thought poverty in London had been overestimated until he mapped it out. Image: Charles Booth Archive / London School of Economics
Booth wasn’t the first to investigate poverty in London. Henry Mayhew interviewed street traders and labourers to record the lives of the poor, while John Snow’s map of cholera deaths around a Soho water pump showed that plotting data by place could reveal hidden patterns.
Advertising helps fund Big Issue’s mission to end poverty
Advertising helps fund Big Issue’s mission to end poverty
Booth’s mapping combined these two very different approaches and presented them in an easily understandable format. The maps demonstrated that poverty wasn’t simply a random event that happened by chance, or the result of personal failings, as many Victorians claimed; instead, it was inextricably linked with work, wages housing and neighbourhood.
Charles Booth’s work helped pave the way for free school meals and old age pensions, reforms that are still with us today. His maps provided evidence that the model homes for the poor built by charities of the era could never hope to alleviate poverty on such a scale.
This helped make the case for public housing, and the newly created London County Council began to build estates, one early example being the Boundary Estate in Shoreditch, which replaced the notorious Old Nichol – among the darkest areas on Booth’s map.
Keep reading the journalism that powers our mission
Register free to continue and learn more about the stories, campaigns and the support we provide, helping people facing poverty across the UK.
Over the following decades, official measures of housing focused on overcrowding and whether a home had an indoor bathroom and toilet. However, such indicators meant that those in the direst housing need – people who had no home at all – were frequently overlooked.
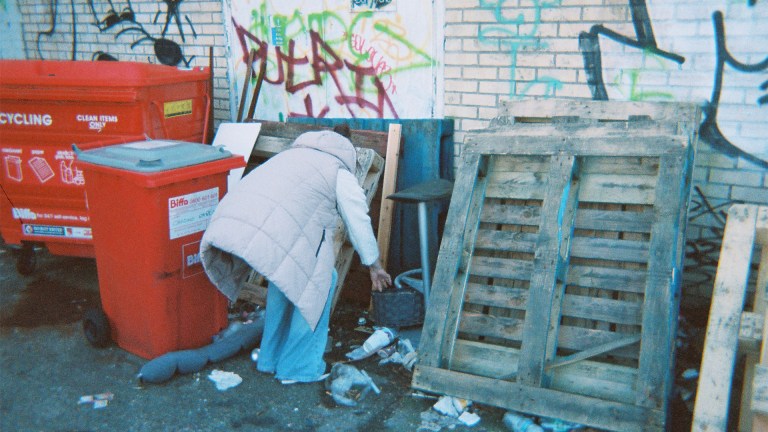
Homelessness became an increasing problem in the postwar era, but it wasn’t until the release of Ken Loach’s television drama Cathy Come Home (1966) that the subject received widespread attention. That drama, which followed one family’s slide into homelessness, shocked the nation and Shelter was founded the same year. A powerful story can still move people in a way data alone cannot.
What has long been clear is that the people best placed to describe housing poverty are those with firsthand knowledge of the subject.
Over the years many organisations and artists have helped them do so. Community publishers such as Hackney’s Centerprise gave working-class Londoners a way to tell their own stories; one item included in the exhibition is a moving book of poems from 2006 by children on their own experiences of homelessness and poor housing.
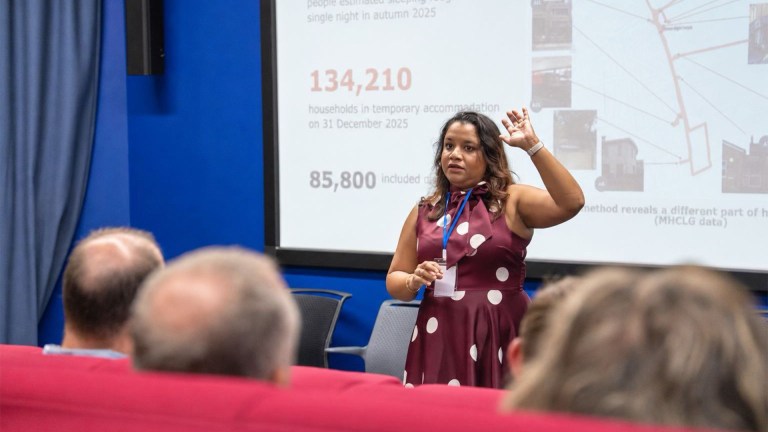
Housing researchers have been quick to make use of technological innovations. Booth used the mapping techniques of his day, just as analysts in the London Office of Technology and Innovation use big data and GPS technologies to analyse routes into and out of homelessness. However the bigger shift has been in who does the research.
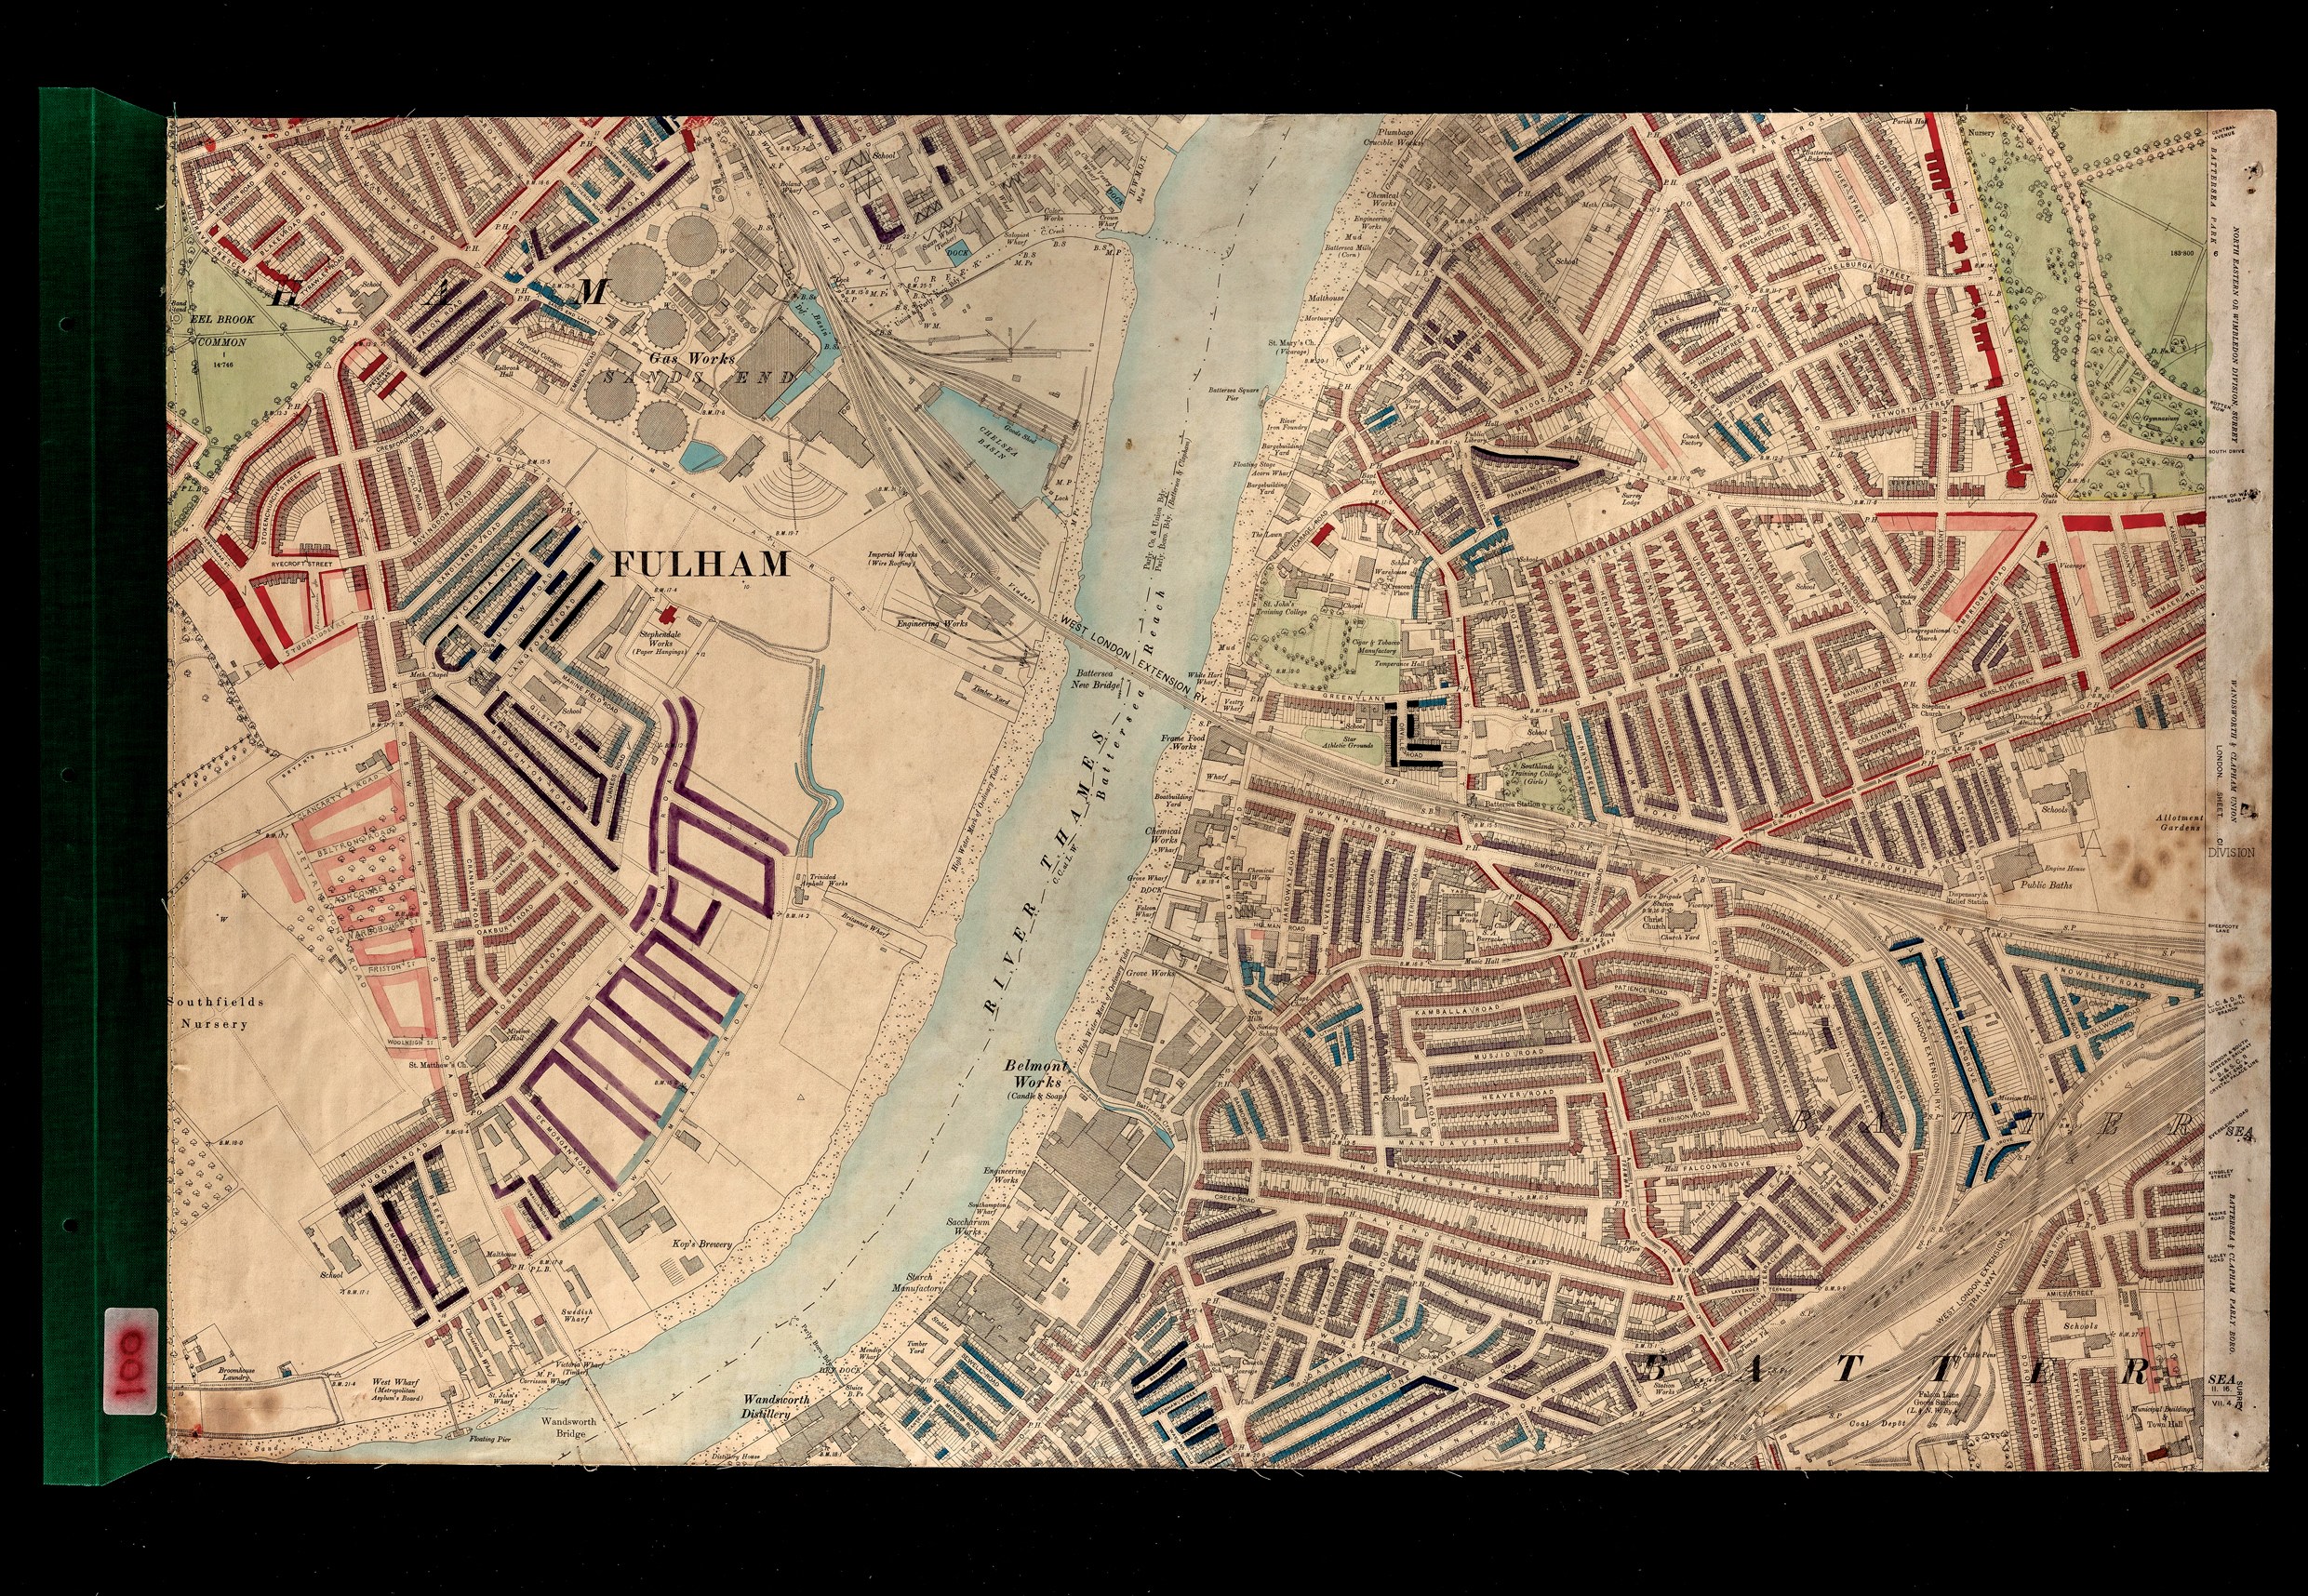
Booth’s maps mattered because they reached people with the power to act. Image: Charles Booth Archive / London School of Economics
Booth treated poorer Londoners as subjects to be studied, rather than people to be heard. Nowadays, researchers increasingly seek to engage residents as co-researchers, involving them in the design and execution of projects as peer researchers or ‘citizen scientists’.
When I was growing up in inner London I had classmates with no indoor lavatories. It’s easy to forget how recently those conditions were normal in London and to realise that today’s problems need not be permanent either.
I was involved in early discussions about the exhibition, and two lessons from this history have stayed with me. The first is that the clearest picture of London’s housing has always come from combining hard evidence with the knowledge of people living through it – neither works on its own.
The second is that simply knowing isn’t enough; Booth’s maps mattered because they reached people with the power to act.
We now have more information about London than he could have dreamed of, yet the crisis persists. The question is no longer whether we can see the problem, but whether we choose to fix it.
Though housing conditions have improved since the days of the Victorian rookeries [slum districts] where it was common to find multiple families sharing a single flat with no running water, heating or lighting, it’s hard to say that they have got better in recent times.
There were more than three times as many people sleeping rough last year – 13,000 – as there were 15 years ago.
We have seen big jumps in overcrowding, in families living in temporary accommodation and private renters living in poverty over the same period.
Some big mistakes have been made over the last 30 years – perhaps above all the decline in social housing, due both to a decline in construction and the selling of existing stock.
But these decisions were largely made despite, not because of, the advice of housing researchers and experts.
Let’s hope a newer generation of politicians takes them more seriously.